 Aller au contenu

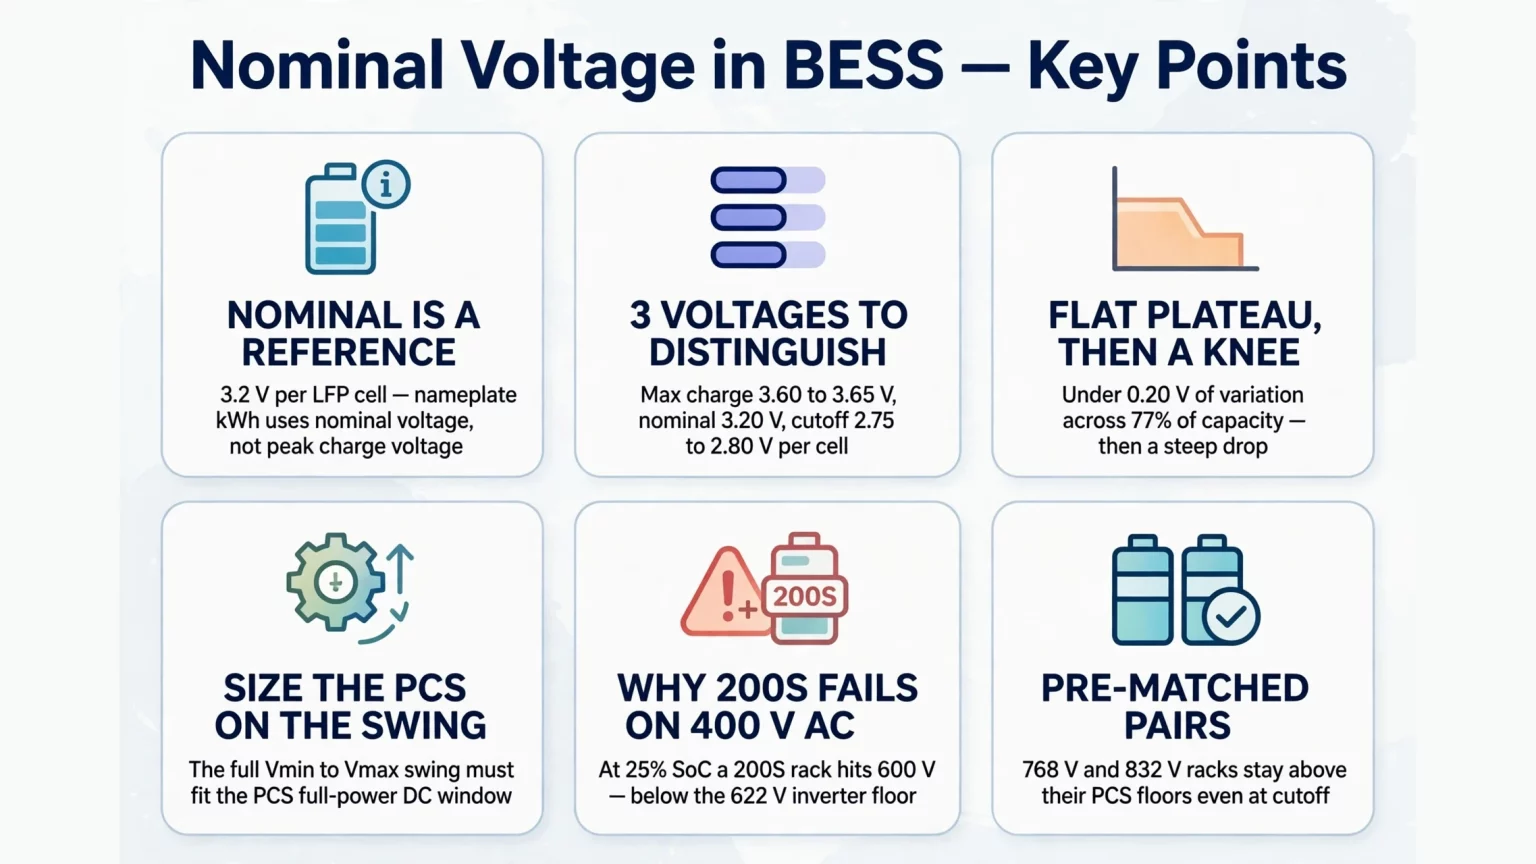
In battery energy storage systems (BESS), nominal voltage represents the standardized reference midpoint voltage assigned to an electrochemical cell or series string across the flat plateau of its discharge cycle.
For lithium iron phosphate (LiFePO4) and hybrid solid-liquid cells, individual nominal cell voltage sits at 3.2V, translating into 768V nominal for a 240S series rack or 832V nominal for a 260S series rack.
However, actual battery terminal voltage does not stay at that midpoint. It varies dynamically across the entire discharge curve, from maximum charging absorption down to minimum low-voltage cutoff.
Building upon our architectural guide on Onduleur de stockage à transformateur intégré vs modulaire systems, electrical engineers must evaluate the complete lithium ion discharge curve against the Power Conversion System (PCS) DC input window.
Pairing battery strings like MegSolid's ESSA0100B-0215 (768V) and Energon 261 (832V) with modular units such as PMA080, PMA0105, and PMA0125 from our MegSolid Energy Storage Inverter & PCS lineup prevents low-voltage power clipping and avoids nuisance overvoltage trips.
Define Nominal Voltage: What Nominal Voltage Means in Cells, Packs & C&I Racks
To define nominal voltage from an engineering perspective, it represents the energy-weighted average voltage during a complete standard discharge cycle at reference conditions (25°C):
V_nominal = (1 / Q_total) × ∫₀^Q_total V(q) dq ≈ 3.20 V (for LFP and hybrid solid-liquid cells)
Understanding nominal voltage meaning clarifies why battery nameplate energy (kWh) is calculated from nominal voltage multiplied by rated charge capacity (Ah), rather than peak charge voltage or resting open-circuit voltage:
- MegSolid's ESSA0100B-0215 Outdoor Cabinet Energy Storage System (100 kW / 215.04 kWh) uses a 1P240S series string of 280Ah cells, yielding 240 × 3.2V = 768.0V nominal, and 768.0V × 280Ah = 215.04 kWh.
- MegSolid's Energon 261 Liquid-Cooled C&I Energy Storage System (125 kVA / 261.24 kWh) uses a 1P260S series string of 314Ah cells, yielding 260 × 3.2V = 832.0V nominal, and 832.0V × 314Ah = 261.25 kWh.
- In our residential lineup, the MEG-Solid-512314FL1 Hybrid Solid-State Battery (16.07 kWh) uses a 16S series arrangement, giving 16 × 3.2V = 51.2V nominal.
Three Voltage Limits Every System Designer Must Separate
What nominal voltage means in practice is a reference label, not an operating boundary. Designers must coordinate three distinct voltage levels:
- 1. Maximum Charge Voltage (V_max): the upper voltage ceiling where constant-voltage charging terminates, which must remain below the PCS maximum allowable DC input insulation limit.
- 2. Nominal Voltage (V_nom): the middle plateau where the system spends the majority of its operating hours and where PCS power conversion efficiency operates near its peak.
- 3. Minimum Discharge Cutoff Voltage (V_min): the lower protection threshold where BMS or inverter firmware stops discharging, which must stay above the PCS minimum full-power DC voltage limit.
Decoding the Lithium-Ion Discharge Curve: Plateau vs. Knee Zones
Examining a real-world lithium ion battery discharge curve reveals why battery sizing requires more than simple midpoint voltage math.
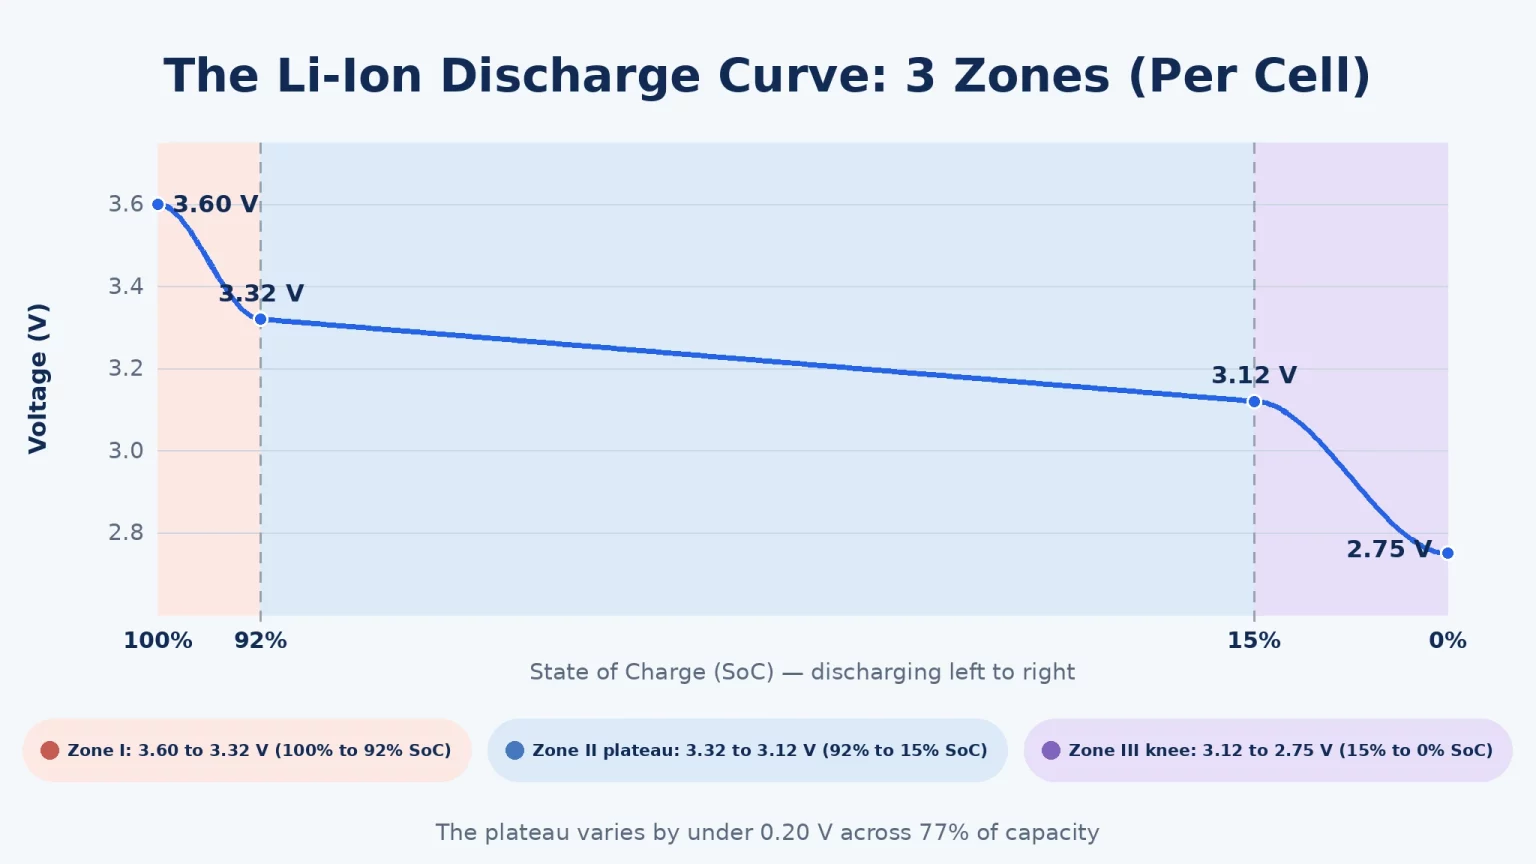
Unlike lead-acid batteries that exhibit a continuous downward voltage slope, an LFP or hybrid solid-liquid li ion discharge curve displays three distinct electrochemical operating regions.
Table 1: Three Operating Zones of the Lithium Ion Battery Discharge Curve
| Discharge Curve Zone | State of Charge (SoC) Range | Cell Terminal Voltage Trend | Electrochemical Driver | System & PCS Impact |
|---|---|---|---|---|
| Zone I: Initial Exponential Drop | 100% to 92% SoC | Drops from 3.60V to 3.32V | Rapid decay of surface charge polarization and concentration overpotential | Brief initial transition; DC current stabilizes quickly under constant-power discharge |
| Zone II: Two-Phase Flat Plateau | 92% to 15% SoC | Stays between 3.32V and 3.12V | Coexistence of LiFePO4 and FePO4 phases (Gibbs phase rule zero degrees of freedom) | Voltage varies <0.20V/cell across 77% capacity; PMA PCS runs at peak 98.7% efficiency |
| Zone III: Terminal Discharge Knee | 15% to 0% SoC | Plunges from 3.12V to cutoff (2.75V–2.80V) | Lithium depletion in active cathode lattice and steep mass-transport polarization | Terminal voltage drops rapidly; potential risk of PCS low-voltage derating if mismatched |
Why the Flat Plateau Governs DC Current Stability
In Zone II, cell terminal voltage varies by less than 0.20V across roughly 77% of the total delivered energy.
Because terminal voltage remains stable, DC bus current (I_DC = P_DC / V_DC) exhibits minimal fluctuation during constant-power peak-shaving cycles.
This stability reduces thermal cycling on inverter IGBT modules and minimizes resistive heating (I^2R) across internal DC copper busbars.
How C-Rate Shifts the Lithium Ion Discharge Curve Downward
Applying discharge current causes cell terminal voltage (V_terminal) to sag below open-circuit voltage (V_OCV) by an amount proportional to internal DC resistance:
V_terminal = V_OCV − I_discharge × R_DCIR
On MegSolid's SHS180-314Ah hybrid solid-liquid cell featured on our MegSolid 314Ah Hybrid Solid-State Battery page, nominal DC resistance is 0.4 ± 0.1 mΩ at 25°C.
Discharging a 314Ah cell at 0.5C (157A) shifts the operating voltage downward by approximately 157A × 0.0004 Ω ≈ 0.063V per cell.
Across an entire 260S string (Energon 261), that 0.5C load translates into a 16.3V to 19.5V downward curve shift.
Increasing the discharge rate to 1C (314A) doubles that ohmic drop to roughly 0.126V to 0.150V per cell (32.8V to 39.0V at the string level), highlighting why high-rate projects must verify the PCS minimum voltage floor under full C-rate current.
Master Voltage & PCS Matching Table: Rack Envelopes vs. PCS DC Windows
Table 2 compares series battery topologies against the DC input windows of MegSolid's modular and utility power conversion stages across our Systèmes de stockage d'énergie à l'état solide et Stockage d'énergie commercial et industriel portfolios.
Table 2: Series Battery Racks vs. PCS Full-Power DC Windows
| System / Battery Model | Series Topology | Nominal Rack Voltage | Operating DC Voltage Window | Matched PCS Model | PCS DC Voltage Window | Max PCS Efficiency |
|---|---|---|---|---|---|---|
| MEG-Solid-512314FL1 Pack | 16S1P | 51,2 V | 43.2V to 57.6V DC | G2S-C Hybrid Inverter | 40V to 58V DC | <20 ms backup switch |
| ESSA0050B-0100 Cabinet | 1P112S | 358.4V | 319.2V to 397.6V DC | Integrated 50 kW PCS stage | Dedicated internal DC bus | Integrated C&I design |
| ESSA0030B-0055 / 0050B-0055 | 1P144S | 460.8V | 403.2V to 511.2V DC | Integrated 30 kW / 50 kW PCS | Dedicated internal DC bus | Integrated C&I design |
| MegSolid ESSA0100B-0215 | 1P240S | 768.0V | 672.0V to 850.0V DC | PMA0105 Modular PCS | 630–950V full power window | 98.7% Max. efficiency |
| MegSolid Energon 261 | 1P260S | 832.0V | 676.0V to 936.0V DC | PMA0125 Modular PCS | 680–950V full power window | 98.7% Max. efficiency |
| Utility 1,000V Racks / Skid | 260S1P | 832.0V | 728.0V to 936.0V DC | MEGA PCS (500 kW–1,000 kW) | 650V to 1,000V DC | Central utility topology |
| MegSolid 5000INTL Utility Container | 12P416S | 1,331.2V | 1,123.2V to 1,497.6V DC | MEGA PCS (1.25 MW–2.5 MW) | 1,050V to 1,500V DC | 87.5% Max. efficiency |
Why Incorrect Voltage Window Sizing Causes Power Derating or Inverter Trips
Mismatched voltage ranges between battery strings and inverters can cause unexpected capacity loss or nuisance alarms during commissioning.
Engineers must verify two electrical boundaries when coordinating high-voltage strings with three-phase power conversion systems.
1. The Lower Boundary: Preventing Low-SoC Inverter Power Derating
In a three-phase 400V_AC grid-tied inverter without a separate DC-DC boost stage, synthesizing a sinusoidal output waveform requires that DC link voltage exceed peak line-to-line AC voltage with adequate modulation reserve:
V_DC,min = √2 × V_AC,line-to-line × 1.10 = 1.414 × 400 V × 1.10 ≈ 622–650 V DC
Factoring in grid overvoltage margins, AC filter impedance, and semiconductor conduction losses, single-stage transformerless PCS designs establish a full-power DC input floor around 622V to 650 Vdc.
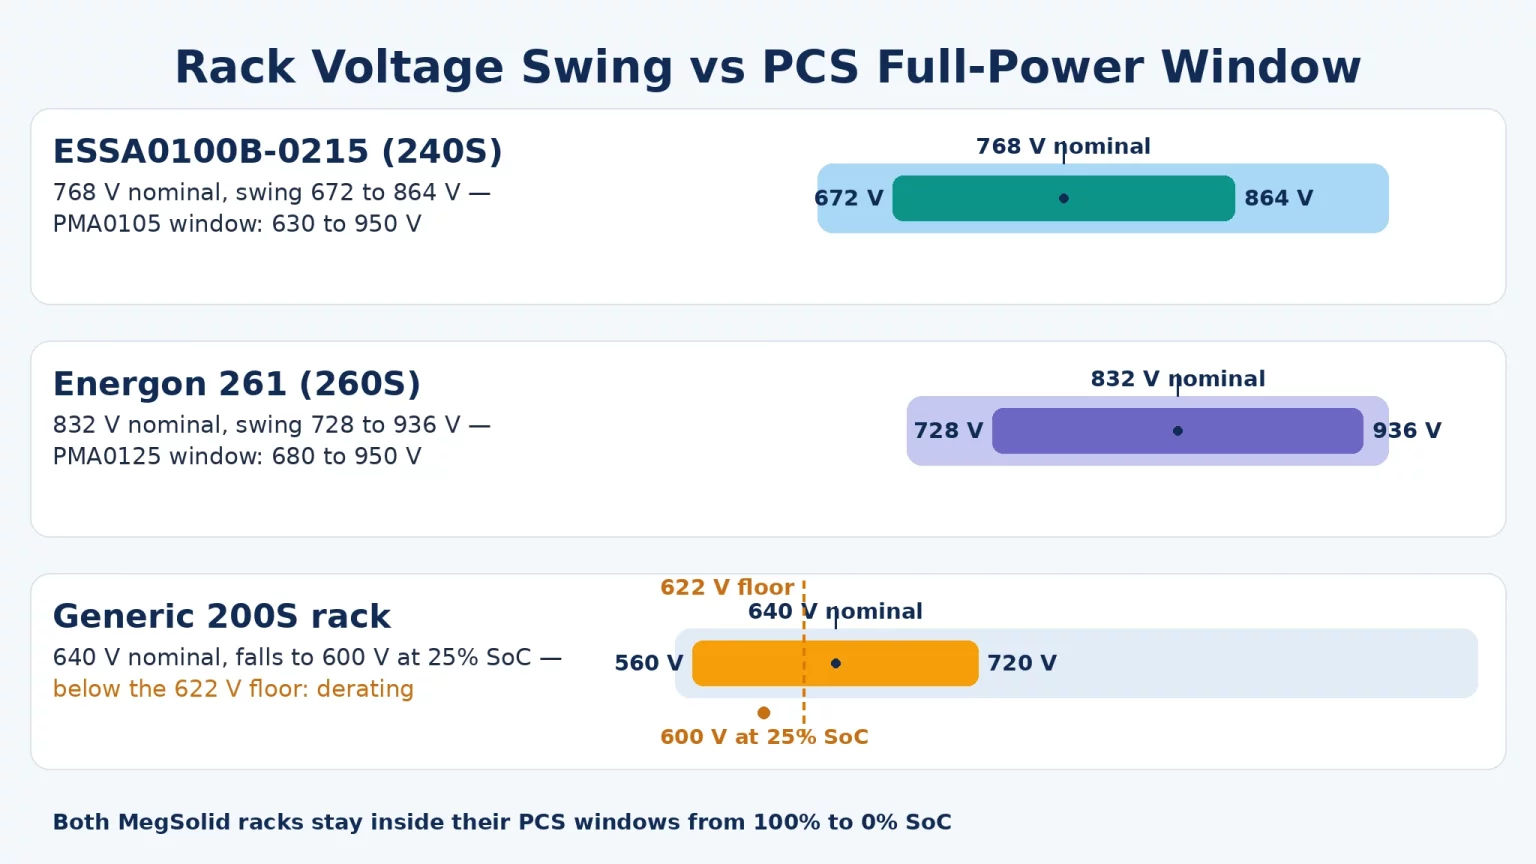
Consider what happens if an undersized string (such as an illustrative 200S rack, 640.0V nominal) connects to a 400V_AC PCS:
- When the li ion discharge curve drops into the lower knee at 25% SoC (3.00V/cell × 200 = 600.0V), DC voltage sags below the 622V modulation limit.
- Falling below the minimum threshold forces the PCS to either derate active power or trip on DC undervoltage, stranding up to 25% of battery capacity inside the rack.
- In contrast, ESSA0100B-0215 (1P240S, 672–850V) maintains 672.0V at cutoff, remaining safely inside PMA0105's 630V–950V full-power window.
- Similarly, Energon 261 (1P260S, 676–936V) maintains 728.0V at 2.80V/cell and 676.0V at absolute cutoff, staying above PMA0125's 680V floor across 5% to 100% SoC.
2. The Upper Boundary: Avoiding High-Voltage Shutdowns and Insulation Stress
Upper voltage boundaries are equally critical. Connecting too many cells in series pushes absorption charge voltage above the inverter's maximum DC rating (1,000 Vdc or 1,500 Vdc).
If an engineer assembled a 280S LFP string (280 × 3.2V = 896V nominal), charging at 3.60V/cell would push string voltage to 1,008V, triggering DC overvoltage protection on a 1,000V-rated PCS.
In MegSolid's Energon 261 (1P260S), the maximum string voltage of 936V (260 × 3.60V) provides a safety margin below the 950 Vdc upper operating limit of PMA modular PCS units and the 1,000V insulation rating of standard switchgear.
In-Depth Look: PMA080–PMA0125 Modular PCS Sizing & Current Capacity
MegSolid's PMA080, PMA0105, and PMA0125 modular PCS units (80 kW, 105 kW, and 125 kW AC) are designed for rack-mounted commercial energy storage integration.
Each module provides a wide DC operating window (615–950 Vdc for 3W+PE or 650–950 Vdc for 3W+N+PE), an official 98.7% Max. efficiency rating, and a <20 ms charge-to-discharge switching time.
Evaluating DC Current Demand Along the Discharge Curve
Because energy storage inverters operate primarily in Constant Power (CP) mode during commercial peak shaving, DC current increases as battery voltage declines:
I_DC = P_AC / (η_PCS × V_DC)
Consider an illustrative calculation for an Energon 261 battery string paired with a PMA0125 (125 kW AC) modular PCS at a nominal conversion efficiency of 98.5%:
- At nominal voltage (832V): I_DC = 125,000 W ÷ (0.985 × 832V) ≈ 152.5A (0.48C).
- At 2.80V/cell end-of-discharge knee (728V): I_DC = 125,000 W ÷ (0.985 × 728V) ≈ 174.3A (0.55C).
- At absolute lower string cutoff (676V): I_DC = 125,000 W ÷ (0.985 × 676V) ≈ 187.7A (0.60C).
Because the PMA0125 specification provides a maximum DC current rating of ± 230A and supports continuous current above 195A, the inverter maintains 100% full power from 5% to 100% SoC without power clipping.
For utility-scale deployments, MegSolid's MEGA PCS platform (500 kW to 2.5 MW) supports both 1,000V strings (parallel 260S racks across 650V–1,000V) and 1,500V containerized blocks (5000INTL 416S strings across 1,050V–1,500V), using multi-branch DC inputs to prevent inter-rack circulating currents.
For customized multi-cabinet architectures, verify DC bus protection, disconnect ratings, and CAN communication compatibility with our engineering team via Contact MegSolid.
FAQ
Why is it difficult to determine lithium battery State of Charge from voltage alone?
Across Zone II of the lithium ion discharge curve (15% to 90% SoC), cell voltage varies by only a few tens of millivolts due to stable two-phase intercalation. Even an instrument measurement offset of 10 mV can translate into a 20% error in estimated State of Charge. Consequently, industrial BESS controllers rely on continuous Coulomb counting (∫ I dt) combined with periodic OCV recalibration during extended rest periods.
Why do modern C&I energy storage systems favor 832V (260S) over older 768V (240S) strings?
Increasing series cell count from 240S (768V nominal) to 260S (832V nominal) raises the lower end-of-discharge string voltage from 672V to 676V. For a given kilowatt output, higher operating voltage reduces DC current by approximately 8%, lowering cable losses (I^2R) and providing additional operating margin above the inverter's minimum DC input limit.
How does ambient temperature affect the lithium ion battery discharge curve?
Cold operating temperatures increase electrolyte viscosity and charge-transfer resistance, causing terminal voltage to sag earlier under load. On the SHS180-314Ah specification sheet, lower discharge cutoff voltage is adjusted from 2.5V (>0°C) to 2.0V (≤ 0°C) to accommodate cold polarization. Liquid-cooled enclosures like Energon 261 maintain internal module temperatures within -20°C to +55°C, stabilizing the discharge curve across seasons.
Can an ESSA0100B-0215 cabinet connect directly to an external third-party PCS?
ESSA0100B-0215 is an integrated outdoor energy storage cabinet equipped with its own internal 100 kW power conversion stage and BMS controller. While its internal battery string operates across 672–850V DC, connecting an external PCS requires reviewing single-line diagrams, DC isolation switchgear, and BMS communication protocols with MegSolid.
What is the difference between Constant Current and Constant Power discharge curves?
Under Constant Current (CC) discharge, current remains fixed while delivered power (P = V × I) drops gradually as voltage declines. Under Constant Power (CP) discharge, common in commercial peak shaving, the inverter increases DC current (I = P / V) as battery voltage falls, causing faster voltage drop near the end of discharge.
Why do 51.2V low-voltage battery packs require different inverters than C&I racks?
Low-voltage battery packs like MEG-Solid-512314FL1 (51.2V nominal, 43.2–57.6V DC) operate below the peak AC grid voltage (565V). They require hybrid inverters like our G2S-C (3–6 kW) equipped with an internal DC-DC converter or high-frequency transformer to step up voltage before synthesizing 230V_AC single-phase power.
What is the maximum DC voltage for 5000INTL utility container systems?
MegSolid's 5000INTL containerized system uses a 12P416S string configuration with a rated DC voltage of 1,331.2V and an operating range of 1,123.2V to 1,497.6V DC. This matches the 1,050V to 1,500 Vdc input window of central utility-scale power conversion systems.
Does Depth of Discharge (DoD) change a battery's nominal voltage rating?
No. Nominal voltage is a physical constant of the cell chemistry and series cell count, remaining fixed regardless of whether the system operates across an 80% DoD or 100% DoD cycle window. However, operating over a narrower DoD window (such as 10% to 90% SoC) confines battery cycling strictly to Zone II, avoiding the steep voltage knee.
How does cell internal resistance (DCIR) affect the lower voltage cutoff?
Higher DC internal resistance produces greater voltage drop under discharge current (I × R_DCIR). Any high-resistance or aged cell reaches its low-voltage cutoff earlier than balanced cells in the same string, causing the BMS to terminate discharge prematurely.
What role does BMS cell balancing play in preserving rack voltage stability?
If individual cells within a series string develop State of Charge divergence, the lowest-capacity cell hits the discharge cutoff first while other cells still hold energy. Active or passive BMS balancing equalizes cell voltages during the upper charging plateau, ensuring the entire series string discharges uniformly across Zone II.
Coordinating Battery Racks and Power Conversion Systems with MegSolid
Understanding nominal voltage meaning and mapping the complete lithium ion discharge curve against inverter DC operating windows prevents project commissioning delays and capacity losses.
Selecting factory-coordinated storage systems ensures that every kilowatt-hour of nameplate battery capacity is delivered cleanly at full AC power rating.
Explore our architectural comparison of Transformer-Integrated vs Modular Energy Storage Inverter topologies to evaluate system configurations for your facility.
Browse our complete portfolio of MegSolid Energy Storage Inverter & PCS platforms, pre-engineered to match our ESSA0100B-0215 (768V), Energon 261 (832V), and 5000INTL (1,331.2V) storage platforms.
- Request Engineering Sizing Support: Connect with our technical team via Contact MegSolid for single-line diagrams, voltage-window matching charts, and project quotations.
