
Battery load testing is the engineering verification of a battery's delivered charge capacity (Ah) or energy (kWh), internal impedance response, thermal behavior, and voltage stability under a controlled electrical discharge.
Resting open-circuit voltage (OCV) only reflects equilibrium terminal potential at zero current. Performing an authentic battery load test requires applying a defined Constant Current (CC) or Constant Power (CP) discharge through a calibrated load bank or bidirectional inverter until the unit reaches its specified test termination condition.
In commercial microgrids, 51.2V solar racks, and utility storage plants, structured load testing underpins Factory Acceptance Testing (FAT) and Site Acceptance Testing (SAT) alongside standards such as IEC 62620 (industrial cells and batteries) and IEC 62933-2-1 (grid energy storage system performance).
Across our Commercial & Industrial Energy Storage lineup, commissioning engineers apply model-specific test protocols to verify air-cooled cabinets like the ESSA Series Outdoor Cabinet Energy Storage System (55.296 to 215.04 kWh) and liquid-cooled platforms like the Energon 261.24kWh Liquid-Cooled C&I Energy Storage System (125 kVA).
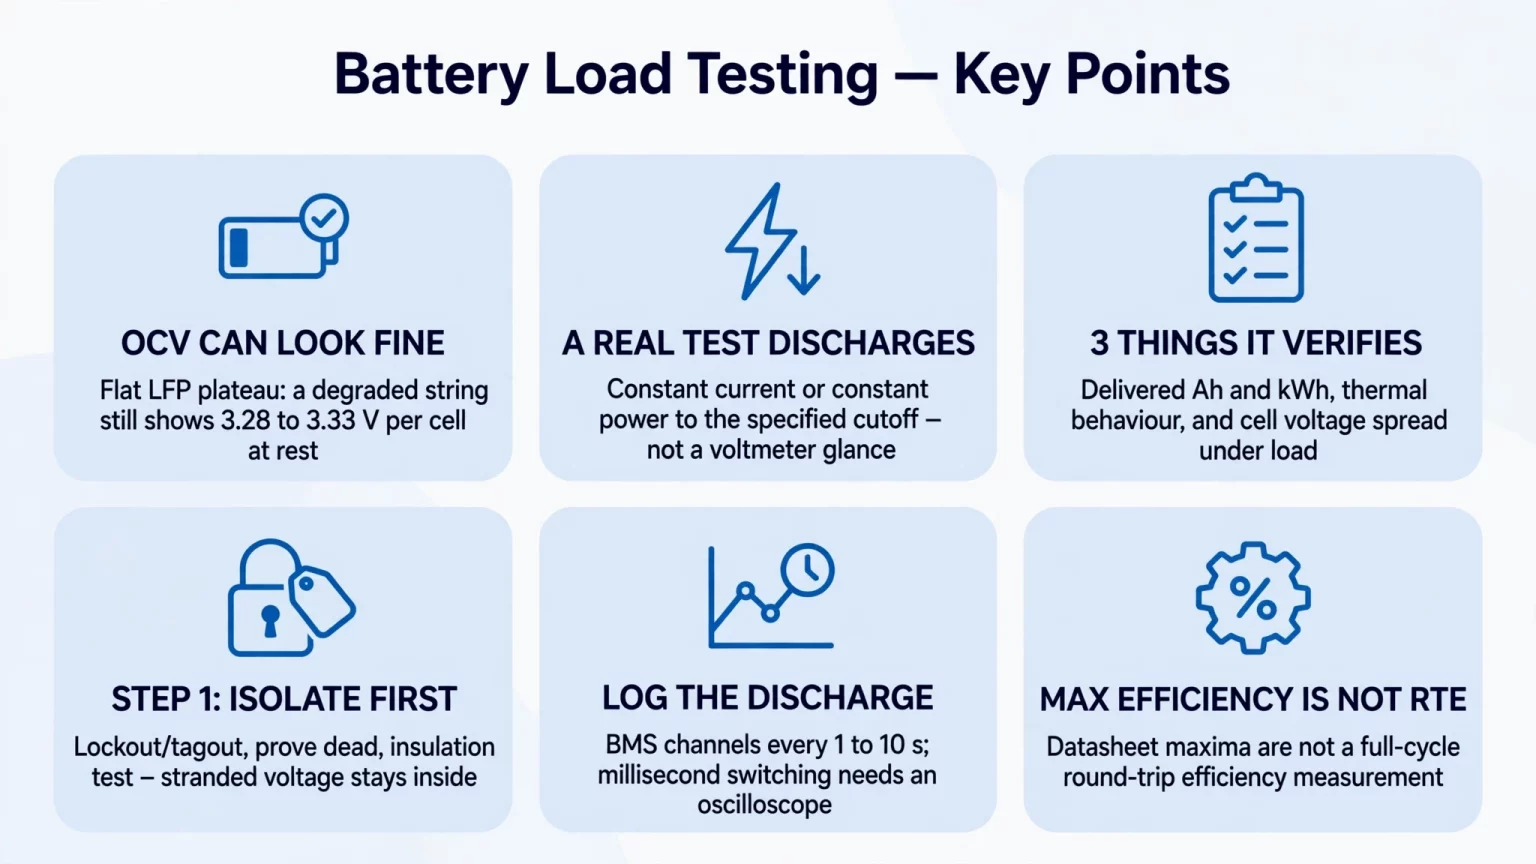
What Is Battery Load Testing? (Open-Circuit Voltage vs. True Dynamic Load Test)
Handheld voltmeter checks create a false sense of security during electrical commissioning.
Resting LiFePO4 (LFP) and hybrid solid-state strings exhibit a flat open-circuit voltage plateau between 30% and 90% State of Charge (SoC).
Even a degraded string with elevated internal resistance or a poor interconnect joint can display normal resting open-circuit voltage (roughly 3.28V to 3.33V per cell, or about 52.5V to 53.3V on a 51.2V-nominal 16S pack and 853V to 866V on an 832V-nominal 1P260S string) while sitting idle.
When you load test battery strings under active current, every cell and busbar connection must sustain current across three internal impedance components:
- Ohmic resistance (R_Ω): immediate voltage drop across terminals, welded tabs, busbars, separator pores, and bulk electrolyte.
- Charge-transfer and SEI resistance (R_ct): kinetic overpotential required for lithium ions (Li^+) to cross the Solid Electrolyte Interphase (SEI) and intercalate into active material particles.
- Concentration polarization (Z_W): solid-state diffusion gradients that steepen as discharge progresses toward the lower voltage knee.
Three Core Objectives of Industrial Battery Load Testing
- 1. Capacity and Energy Verification: verifying cell or battery DC charge capacity (Ah) under IEC 62620 constant-current tests, verifying DC energy (Wh) under manufacturer constant-power (0.5P) specs, or verifying AC delivered energy (kWh) at the point of connection (POC) under IEC 62933-2-1.
- 2. Thermal Behavior Under Sustained Load: confirming that air cooling or liquid cooling keeps cell temperatures and power terminations within specified operating limits across the discharge duration.
- 3. Cell Voltage Consistency (Δ V): identifying weak, un-balanced, or high-impedance outlier cells whose terminal voltage sags prematurely under load and triggers early BMS protection cutoff.
How to Load Test a Battery: Step-by-Step Procedure for Commercial Lithium BESS & 48V Storage
EPC field engineers and commissioning technicians asking how to load test a battery pack or C&I cabinet should follow a five-stage protocol governed by the manufacturer's test manual.
Step 1: Electrical Isolation, Mechanical Inspection & Insulation Verification
Opening external AC or DC breakers and disconnect switches does not remove hazardous voltage inside battery modules or series strings.
Before connecting test equipment to load test batteries, qualified electrical personnel must execute lockout/tagout (LOTO), prove isolated busbars dead with a rated voltage detector, and follow the equipment manual:
- Verify torque marks on accessible module busbars, DC fuse blocks, and main power lugs using insulated tools and arc-flash PPE rated for the string voltage.
- On liquid-cooled systems such as Energon (261.24 kWh) and the 5000INTL 5,015.9kWh Containerized Energy Storage System, inspect coolant expansion tank levels, line pressure, and valve positions prior to starting the circulation loop.
- Perform DC insulation resistance testing between positive/negative DC circuits and protective earth (PE) only at designated test points after isolating BMS voltage-sense harnesses, communication boards, and surge protective devices (SPDs) per the manufacturer's instructions.
- Select the insulation test voltage and pass threshold according to the circuit's rated voltage class and product manual. While R_insulation ≥ 100 MΩ at 1,000 Vdc is sometimes cited as an illustrative benchmark for sub-1,000V C&I circuits, it cannot be applied universally across 51.2V low-voltage packs or 1,500V-class utility containers such as 5000INTL (1,123.2–1,497.6V DC).
Step 2: Pre-Conditioning, Balancing & Soak Charge
Pre-condition the battery pack or cluster according to the charge profile, balancing routine, and rest duration specified in the model's capacity test procedure:
- On the MG 512314 Movable Lithium Battery Pack (51.2V / 314Ah / 16,076 Wh), the official specification lists a standard charge of 0.5C (157A) constant current to 58.4V, holding 58.4V constant voltage until charge current tapers to ≤ 0.01C (3.14A).
- On the MEG-Solid-512314FL1 51.2V 314Ah Hybrid Solid-State Battery (16.07 kWh), the published working voltage window spans 43.2V to 57.6V, with 57.6V specified as the CC-CV charge voltage.
- On high-voltage cabinets such as ESSA0100B-0215 (1P240S, 672–850V DC, or ≈ 3.542V average per cell at 850V) and Energon (1P260S, 676–936V DC, or 3.600V average per cell at 936V), charging is governed by the cabinet's controlled pack CV setpoint and BMS upper cell voltage threshold.
- Do not apply the 3.65V cell-level charge limit of the standalone SHS180-314Ah cell specification sheet as a blanket BMS cutoff across ESSA or Energon cabinets, and never continue charging a series string to force the lowest cell up to the cutoff voltage.
- After charge completion, allow the battery to rest at open circuit for the duration specified by the test standard or product manual (an illustrative 30 to 60 minute rest is common in field protocols) so thermal and electrochemical gradients stabilize.
Step 3: Connecting the Load Bank or Bidirectional PCS
Select the discharge load arrangement based on site capabilities, interconnection rules, and protection coordination:
- Standalone DC or off-grid AC testing: connect a calibrated DC electronic load or AC resistive/reactive (RLC) load bank matched to the required test power and voltage window, with hardwired trip interlocks tied to the BMS protection output.
- Grid-tied or facility-load testing: where internal plant load is sufficient, protection relays are coordinated, and the utility interconnection agreement permits (or zero-export control is verified), engineers can use a bidirectional PCS from our Energy Storage Inverters portfolio to discharge into facility loads.
- MegSolid's PMA080–PMA0125 Modular PCS (80 kW, 105 kW, and 125 kW AC; 615–950 Vdc for 3W+PE or 650–950 Vdc for 3W+N+PE) lists up to 98.7% maximum efficiency (Max. efficiency) on its PCS datasheet; however, reverse power export to the utility grid must never be assumed without utility authorization.
Step 4: Continuous Discharge Execution & Data Logging
Discharge the system at the current or power specified in the product's test procedure until the designated test termination condition (BMS cutoff, pack voltage limit, or target SoC floor) is reached:
- Distinguish operating voltage range from capacity test cutoff: MG 512314 specifies ≥ 314Ah rated capacity at 0.2C (62.8A) and a 40.0–58.4V operating window, while MEG-Solid-512314FL1 specifies a 43.2V discharge cutoff; always use the exact discharge termination condition defined in the model's capacity test protocol rather than assuming every test runs to the absolute hardware lower limit.
- At the bare-cell level, the SHS180-314Ah hybrid solid-liquid cell on our MegSolid 314Ah Hybrid Solid-State Battery page is tested at 0.5P (25°C, 2.5–3.65V above 0°C) to verify 314Ah and 1,005 Wh.
- Distinguish cell C-rate from cabinet AC power rating: in the ESSA outdoor cabinet series, ESSA0030B-0055 (30 kW AC) and ESSA0050B-0055 (50 kW AC) both share a 55.296 kWh 1P144S battery bank built with 3.2V/120Ah/1C LFP cells.
- By contrast, ESSA0050B-0100 (50 kW / 100.352 kWh, 1P112S) and ESSA0100B-0215 (100 kW / 215.04 kWh, 1P240S) use 3.2V/280Ah LFP cells (0.5C cell cycle condition) paired with 50 kW and 100 kW AC PCS stages.
- Choose instrumentation to match the test objective: logging BMS and power meter channels every 1 to 10 seconds is appropriate for steady-state capacity and thermal trend tracking, whereas verifying millisecond-level PCS switching (<20 ms) requires a high-speed oscilloscope or waveform recorder.
Step 5: Delivered Energy (kWh) and Round-Trip Efficiency (RTE) Calculation
Integrate logged power over discharge time in hours (t_cut,h), or sum discrete voltage (V_DC in V) and current (I_DC in A) samples taken at interval Δ t_s (in seconds):
E_discharge,DC (kWh) = ∫ from 0 to t_cut,h P_DC,kW(t) dt = Σ [V_DC(t) × I_DC(t) × Δt_s / 3,600,000]
When evaluating a full charge-discharge cycle between identical starting and ending SoC states and identical measurement boundaries, calculate Round-Trip Efficiency (RTE):
η_RTE,DC (%) = E_discharge,DC / E_charge,DC × 100%; η_RTE,AC (%) = E_discharge,AC / E_charge,AC × 100%
Keep three efficiency definitions strictly separate during SAT reporting:
- Cell-level DC energy efficiency: the SHS180-314Ah cell specification sheet lists ≥ 94.5% energy efficiency at 0.5P and 25°C.
- Published maximum efficiency figures: Energon lists 90% Max. efficiency, 5000INTL lists 87.5% Max. efficiency, and PMA modular PCS units list 98.7% Max. efficiency. Because the cabinet pages do not specify the exact measurement boundary for their maximum efficiency figures, do not relabel them as peak PCS conversion efficiency or equate them to full-cycle AC-to-AC RTE.
- System AC round-trip efficiency (η_RTE,AC): under IEC 62933-2-1, specify the exact point of connection (POC) and state whether auxiliary loads (liquid chillers, fans, BMS, and controls) are included in the net AC meter boundary or metered separately.
BESS Factory Acceptance Testing (FAT) vs. Site Acceptance Testing (SAT) Checklist
Table 1 separates cell/pack DC testing (IEC 62620 and manufacturer constant-power specs), system AC performance testing (IEC 62933-2-1), and published reference parameters across our Solid-State Energy Storage Systems and LFP product lines.
Table 1: Industrial BESS FAT & SAT Load Testing Verification Matrix
| Test Stage & Boundary | Measurement Method | Engineering Verification Scope | Published MegSolid Reference Data |
|---|---|---|---|
| FAT: Cell & Pack DC Capacity / Energy | CC/CV charge and specified DC discharge at 25°C | Verify DC Ah (IEC 62620 CC) or DC Wh (0.5P CP spec) per model | SHS180-314Ah: 314Ah / 1,005 Wh @ 0.5P; MG 512314: ≥ 314Ah @ 0.2C |
| FAT: Internal Impedance Check | 4-wire Kelvin 1 kHz ACIR and step-current DCIR | Verify against cell or pack datasheet limit under stated method | SHS180-314Ah: 0.18 ± 0.03 mΩ AC, 0.4 ± 0.1 mΩ DC; MEG-Solid-512314FL1: ≤ 15 mΩ |
| SAT: Pre-Load Insulation Test | DC insulation tester with BMS/SPD isolated per LOTO manual | Test voltage & MΩ limit per voltage class (51.2V vs 1,000V vs 1,500V) | Check manual for Energon (676–936V), ESSA (319.2–850V across models), or 5000INTL (1,123.2–1,497.6V) |
| SAT: System AC Discharge & Thermal Log | Discharge at rated AC power (IEC 62933-2-1 POC boundary) | Verify AC delivered kWh per contract and IR scan of terminations | Energon liquid cooling (-20°C to +55°C; 1–3°C cell Δ T target to confirm per test spec) |
| SAT: High-Speed Switching Verification | Oscilloscope or high-speed waveform recorder (not BMS CSV) | Separate PCS charge/discharge reversal from backup transfer per test spec | PMA080–0125 PCS: <20 ms charge-to-discharge switch; G2S-C inverter: <20 ms backup switch |
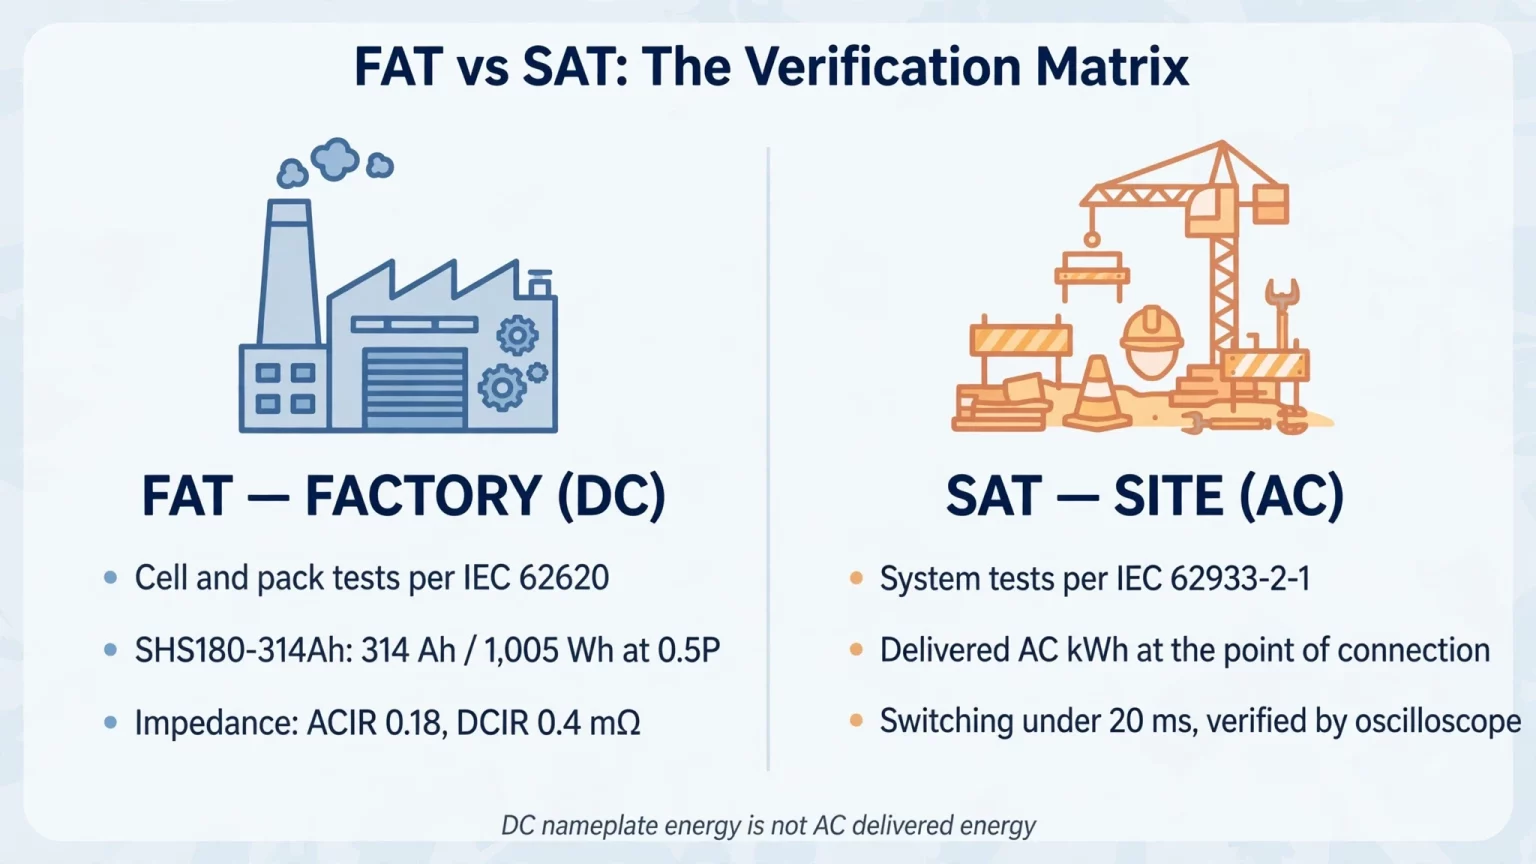
Note: Battery DC nameplate energy does not equal AC delivered energy at the point of connection due to depth-of-discharge windows, conversion losses, and auxiliary loads. Request model-specific FAT/SAT acceptance procedures via Contact MegSolid.
On-Grid vs. Off-Grid Dynamic Load & Fast Transfer Testing (<20ms)
Steady-state capacity testing measures stored energy over hours, whereas dynamic commissioning verifies millisecond-scale power electronics response.
Because standard BMS logs sample every 1 to 10 seconds, commissioning teams must connect an oscilloscope or high-speed power quality recorder across the AC and DC buses to verify <20 ms switching specifications.
1. Bidirectional PCS Charge-to-Discharge Switching (<20ms on PMA Series)
In peak-shaving and frequency-response duties, the power conversion stage must reverse active power direction cleanly without tripping DC bus protection.
On the PMA080, PMA0105, and PMA0125 modular PCS series (80–125 kW rated AC output, ± 150A to ± 230A max DC current), the official specification lists a <20 ms charge-to-discharge switching time.
This metric describes active power reversal between charging and discharging modes, which is distinct from on/off-grid islanding or backup transfer time.
2. Backup Transfer Testing on 48V Hybrid Inverters (<20ms on G2S-C Series)
For single-phase backup installations using our Residential Energy Storage Systems, commissioning includes opening the upstream grid supply breaker under active load.
Our G2S-C Single-Phase Hybrid Inverter series (R3KL1DA-G2S-C to R6KL1DA-G2S-C, 3–6 kW, 40–58V battery input, 60A to 120A max battery current) specifies a <20 ms backup switching time.
When pairing with 51.2V packs, MEG-Solid-512314FL1 (43.2–57.6V, 200A max charge and continuous discharge) sits within the G2S-C's 40–58V port range, whereas MG 512314 (40.0–58.4V, 58.4V standard charge voltage, 200A max current with continuous duty to be confirmed) requires verifying charge voltage settings and BMS protocol compatibility prior to testing.
Whether downstream IT servers, switches, or medical cooling units ride through a transfer without reset depends on each load's allowable voltage-interruption hold-up time and complete system-level transfer testing under actual site load conditions.
For three-phase commercial backup systems using ESSA or Energon cabinets, overall on/off-grid transfer time is governed by the external static transfer switch (STS), switchgear interlocking, and microgrid controller architecture defined in the project single-line diagram.
Load Testing Equipment Comparison: Carbon Pile vs. Resistive Load Bank vs. Regenerative Inverter
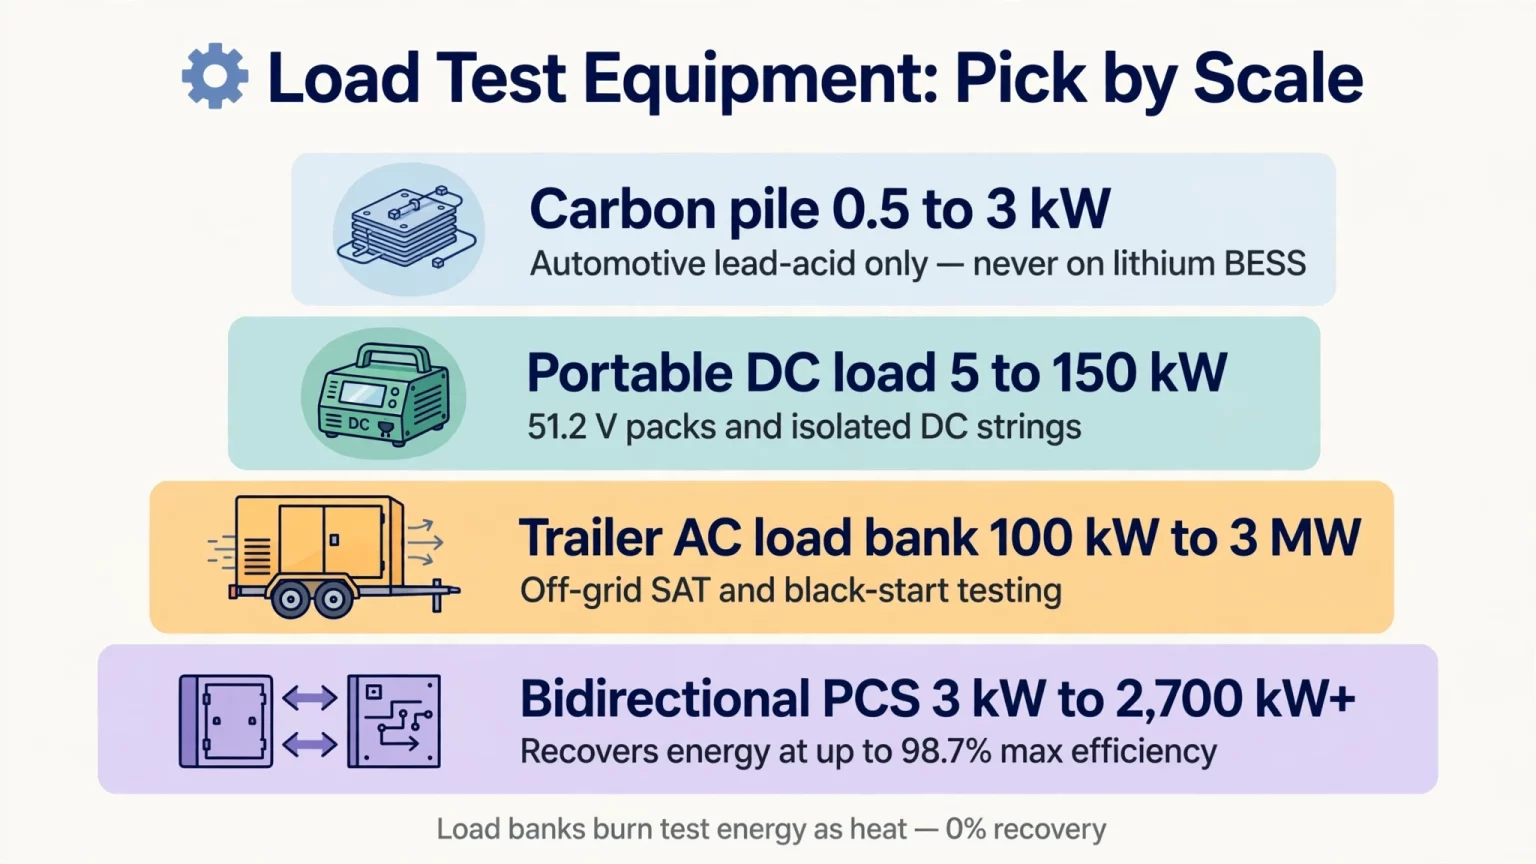
Table 2 compares the four primary categories of equipment used to load test battery cells, 51.2V packs, and high-voltage BESS cabinets.
Table 2: Battery Load Testing Equipment Comparison Matrix
| Equipment Type | Typical Power Range | Energy Recovery | Voltage & Control Capability | Recommended Application |
|---|---|---|---|---|
| Handheld Carbon Pile Tester | 0.5–3 kW (short pulse) | 0% (all heat) | 6V/12V/24V manual rheostat; no cell logging | Automotive lead-acid starter batteries only; never use on lithium BESS |
| Portable DC Electronic / Resistive Load | 5–150 kW | 0% (forced-air resistor heat) | 40–1,000 Vdc programmable CC, CP, or CR modes | 51.2V telecom/residential packs (MEG-Solid-512314FL1, MG 512314) and isolated DC strings |
| Trailer-Mounted AC Resistive/RLC Load Bank | 100 kW–3 MW | 0% (radiator fan dissipation) | 400–690 Vac stepped resistive and reactive loads | Off-grid microgrid SAT, black-start testing, and non-export utility sites |
| Grid-Tied Bidirectional PCS / Hybrid Inverter | 3 kW–2,700 kW+ | Up to 98.7% PCS Max. efficiency (PMA series) | Closed-loop BMS control; plant load feed or permitted grid export | Grid-tied FAT/SAT on ESSA, Energon, and 5000INTL (subject to load & grid rules) |
Common Failure Modes & Diagnostic Criteria in Lithium Battery Load Testing
Field commissioning interruptions can stem from battery string imbalance, PCS parameter mismatches, protection relay coordination, cooling flow restrictions, communication timeouts, or external metering errors.
Below are three battery- and measurement-side diagnostic patterns every commissioning engineer should evaluate:
1. Early Low-Voltage Knee Collapse in Series Strings
In a 1P260S string (Energon, 676–936V DC) or 1P240S string (ESSA0100B-0215, 672–850V DC), the cabinet terminates discharge as soon as the string or any single cell reaches its controlled BMS lower voltage threshold.
Because dividing the cabinet's lower string voltage by cell count only yields an average per-cell voltage (2.600V average on Energon at 676V; 2.800V average on ESSA0100B-0215 at 672V), evaluate individual cell sag against the specific pack's controlled BMS undervoltage parameter rather than borrowing the 2.50V cutoff from the SHS180-314Ah cell sheet.
If one outlier cell hits the BMS undervoltage threshold while the remaining cells sit well inside the mid-SoC plateau, inspect for initial SoC imbalance, localized cell capacity fade, or high cell/interconnect DCIR.
2. Abnormal Cell or Termination Temperature Rise (Δ T)
During sustained full-power discharge, elevated temperature at a terminal lug or module busbar can result from an under-torqued fastener, contact oxidation, undersized cabling, restricted local airflow or coolant flow, sustained overcurrent, or connector geometry.
Conduct an infrared thermography scan near the end of the discharge plateau when conductor temperatures stabilize, and verify that cabinet cell temperature spread stays within the model's thermal specification.
3. Charge (Ah) and Energy (kWh) Metering Discrepancies
Never compare BMS coulomb counting (∫ I dt, measured in Ah) directly against external energy integration (∫ V · I dt, measured in Wh or kWh), as the two quantities have different physical dimensions.
Compare BMS-reported ampere-hours against independently integrated current over time, and compare BMS-reported energy against independently measured voltage-current energy integration. Use synchronized timestamps and identical measurement boundaries.
Only after ruling out unit mismatches, AC-versus-DC boundary differences, clock synchronization offsets, and instrument accuracy classes should engineers diagnose Hall-sensor/shunt zero-offset drift or CAN/RS485 communication latency.
FAQ
How do cell test C-rates differ from cabinet load test ratings?
Cell specification sheets define electrochemical test rates (for example, SHS180-314Ah is rated at 0.5P, and MG 512314 rates capacity at 0.2C), whereas turnkey cabinets are tested up to their rated AC output power. For instance, ESSA0030B-0055 (30 kW AC) and ESSA0050B-0055 (50 kW AC) both incorporate 55.296 kWh 1P144S strings of 120Ah 1C LFP cells, yet their cabinet AC load test ceilings are 30 kW and 50 kW respectively.
Why must series string charging terminate on the highest cell or pack CV limit?
In a series string, every cell carries the same charge current, so any cell with slightly higher initial SoC or internal impedance reaches the BMS upper cell voltage threshold first. Continuing to force charge current to bring the lowest cell up would overcharge the highest cell; instead, the pack enters constant-voltage (CV) taper and relies on BMS balancing within the model's controlled voltage limits.
What is the difference between Constant Current (CC) and Constant Power (CP) load testing?
Under Constant Current (CC) discharge, DC current (I) stays constant while power (P = V · I) declines gradually as battery voltage decreases. Under Constant Power (CP) discharge, the inverter or load bank draws progressively higher DC current (I = P / V) as string voltage drops toward the end of discharge, increasing I^2R heating during the final discharge stage.
Why do published max efficiency figures differ from measured AC Round-Trip Efficiency (RTE)?
Datasheet specifications such as 90% max efficiency on Energon or 87.5% max efficiency on 5000INTL report maximum efficiency under manufacturer-defined conditions without specifying a full-cycle AC-to-AC boundary. Measured AC round-trip efficiency (η_RTE,AC) reflects cumulative charge conversion, battery polarization, and discharge conversion losses over a complete cycle, and is further reduced when auxiliary cooling and control loads are included.
Is a 1,000V DC Megger test safe to apply across all BESS circuits?
No. Applying 1,000 Vdc across connected BMS voltage-sense boards, communication lines, or 51.2V low-voltage packs can damage electronic components, while 1,500V-class containers like 5000INTL follow higher-voltage insulation test specs. Qualified personnel must isolate sensitive electronics per the equipment manual and select an insulation test voltage matched to the circuit's voltage rating.
How often should commercial BESS installations undergo capacity load testing?
While some facility O&M programs schedule periodic capacity verification every 12 to 24 months as an illustrative maintenance interval to recalibrate BMS State of Health (SoH) estimates, there is no single mandatory schedule for all installations. Actual testing intervals should follow the project warranty agreement, cycling duty, and manufacturer O&M manual.
How should engineers size an external load bank for off-grid BESS commissioning?
Rather than relying on a fixed 100%–110% rule of thumb alone, size the external DC or AC RLC load bank according to the required test active and reactive power (P and Q), power factor range, continuous thermal duty duration, load step resolution, site altitude/ambient derating, and the voltage/current limits of the BESS under test.
Is there a universal millivolt (Δ V) pass/fail limit during a battery load test?
No. While well-matched LFP cells often track within a few tens of millivolts across the flat mid-SoC plateau under moderate current at 25°C, measured Δ V varies with cell model, C-rate, temperature, SoC position, and sense-lead geometry. Pass/fail evaluation must use the model-specific FAT/SAT voltage-spread and delivered-energy criteria rather than a generic millivolt figure.
How does cell temperature affect battery load test results?
Cold temperatures increase electrolyte viscosity and DC internal resistance, causing terminal voltage to reach the lower cutoff earlier and reducing measured discharge capacity. MegSolid's SHS180-314Ah and MG 512314 specification sheets reference 25°C for standard capacity and cycle ratings; on the SHS180-314Ah cell sheet, the lower discharge cutoff shifts from 2.5V (>0°C) to 2.0V (≤ 0°C) to account for low-temperature polarization.
Under what conditions can a bidirectional PCS be used for on-site load testing?
Using a grid-tied PCS to discharge test energy requires either sufficient internal plant load to absorb the full test power under verified zero-export control, or explicit utility interconnection permission for reverse power export, alongside verified protection relay coordination.
Commissioning Commercial BESS & 48V Storage Systems with MegSolid
Structured battery load testing helps EPC contractors, facility engineers, and asset owners reduce commissioning risk, diagnose installation faults early, and establish an accurate Beginning-of-Life (BOL) performance baseline.
Whether you are commissioning a 51.2V residential backup bank, a 261.24 kWh liquid-cooled C&I cabinet, or a 5,015.9 kWh utility container, aligning your field test protocol with model-specific cell, pack, and PCS specifications improves test repeatability across FAT and SAT.
- Explore Turnkey C&I & Utility BESS Platforms: Review full technical specifications across our Commercial & Industrial Energy Storage and Energy Storage Inverters portfolios.
- Request FAT/SAT Protocols & Engineering Support: Connect with our commissioning engineers via Contact MegSolid for model-specific FAT/SAT checklists, single-line diagrams, and project quotations.