

Lower battery pricing does not necessarily produce a lower lifetime storage cost. BESS levelized cost of storage (LCOS) compares the present value of lifecycle costs with the present value of energy delivered over the project life, allowing technically acceptable C&I storage proposals to be ranked on one consistent economic basis.
Meaningful LCOS comparison starts only after the project duty has been defined. Required power and discharge duration belong in the Processus de conception du système BESS C&I. Delivered AC energy should come from an agreed measurement basis such as the test de capacité des systèmes de stockage d'énergie par batterie (BESS) à usage commercial, while modeled lifetime throughput needs to remain compatible with the C&I BESS warranty.
Three boundaries determine whether Bid A and Bid B can be compared:
| Input | Required basis |
|---|---|
| Cost boundary | Same lifecycle cost categories |
| Limite énergétique | Same AC delivery point and accounting method |
| Site duty | Same dispatch profile and annual discharged-energy requirement |
The procurement decision is therefore not simply which supplier quotes the lowest battery price.
The real question is which technically suitable BESS delivers the required site energy at the lower lifecycle cost.
Lowest Battery Cost per kWh Is Not Necessarily the Lowest LCOS
Installed $ / kWh remains useful when comparing initial capital intensity, but LCOS answers a different question.
Consider two 2 MWh proposals:
| Proposal | Bid A | Bid B |
|---|---|---|
| Installed price | $1.00 million | $1.08 million |
| Énergie nominale | 2 MWh | 2 MWh |
| Installed cost | $500/kWh | $540/kWh |
Bid A clearly wins the first-price comparison.
Missing from that calculation are several factors capable of changing the lifecycle result:
- delivered AC energy;
- degradation over the study period;
- site utilization;
- future augmentation;
- O&M and mid-life service;
- auxiliary consumption;
- charging electricity when included in the selected methodology.
Installed cost per kWh = installed project cost ÷ specified installed-energy basis
BESS LCOS = present value of included lifecycle costs ÷ present value of lifetime delivered energy
Different display units do not change the economic metric: $0.10/kWh = $100/MWh.
Lower initial $ / kWh becomes a genuine procurement advantage only when the same proposal also retains the lower cost after lifecycle expenditure and lifetime delivery are included.
Normalize Both Proposals Before Comparing Their LCOS
Supplier-reported LCOS values cannot be ranked until the assumptions behind them are aligned.
Bid A might report $120/MWh using a 15-year model that excludes charging electricity, while Bid B reports $145/MWh using a 20-year model that includes charging electricity. The apparent difference says little about which system is actually cheaper.
Common assumptions should be normalized first:
| Comparer | Required rule |
|---|---|
| Project life | Use the same study period |
| Cost boundary | Include the same cost categories |
| Limite énergétique | Use the same AC delivery definition |
| Site duty | Use the same dispatch requirement |
| Financial basis | Align discounting and charging-cost treatment |
| Product evidence | Preserve genuine technical differences |
Normalization should remove spreadsheet differences, not product differences.
Real variation between competing systems may remain in:
- usable AC energy;
- degradation;
- auxiliary consumption;
- warranty-supported throughput;
- augmentation timing;
- lifecycle service cost.
Those differences belong in the final LCOS because they reflect how each system performs inside the same project.
Once the project assumptions are aligned, the next question is whether both proposals count lifecycle cost in the same way.
Use the Same Lifecycle Cost Boundary for Both Bids
Identical $ / MWh units do not guarantee identical LCOS methodology.
Ember's storage-cost analysis provides a useful example. Its methodology reports approximately $65/MWh while excluding charging electricity. The underlying assumptions include a 20-year project life, daily cycling, 90% round-trip efficiency, a 7% discount rate and degradation over time. See the Ember battery storage analysis.
Lazard LCOS v11.0 uses a different boundary. Its 2026 unsubsidized four-hour standalone storage range is approximately $210–292/MWh, with charging electricity included using a $40/MWh assumption and a different US project and financing basis. See Lazard LCOS v11.0.
Both figures can be internally valid while remaining unsuitable for direct comparison.
C&I procurement therefore needs a declared cost boundary:
| Lifecycle cost | Comparison treatment |
|---|---|
| Equipment and EPC | Use the same project scope |
| O&M | Include on the same service basis |
| Charging electricity | Both include or both exclude |
| Augmentation | Include when required |
| Mid-life replacement | Include when modeled |
| End-of-life value | Treat consistently |
Auxiliary consumption also needs one accounting rule. Net AC delivery may already reflect some auxiliary loads, so the same loss should not be charged again elsewhere in the model.
Cost-boundary alignment turns two supplier spreadsheets into one comparable economic framework.
Teams already comparing storage proposals can use that stage to resolve mismatched scope before the headline LCOS values are ranked. MegSolid can help align the project scope, AC measurement point, site dispatch requirement and product-specific inputs so that a lower-looking LCOS is not simply the result of a narrower calculation boundary.
Use the Same Delivered-Energy Boundary in Both LCOS Models
Cost normalization solves only half of the comparison. The denominator needs the same discipline.
Nominal battery ratings should not automatically become lifetime delivered energy. LCOS depends on the energy reaching the agreed AC measurement point under the project's operating constraints.
The relationship is:
Nominal energy → project operating window → usable energy → conversion and auxiliary effects → delivered AC energy
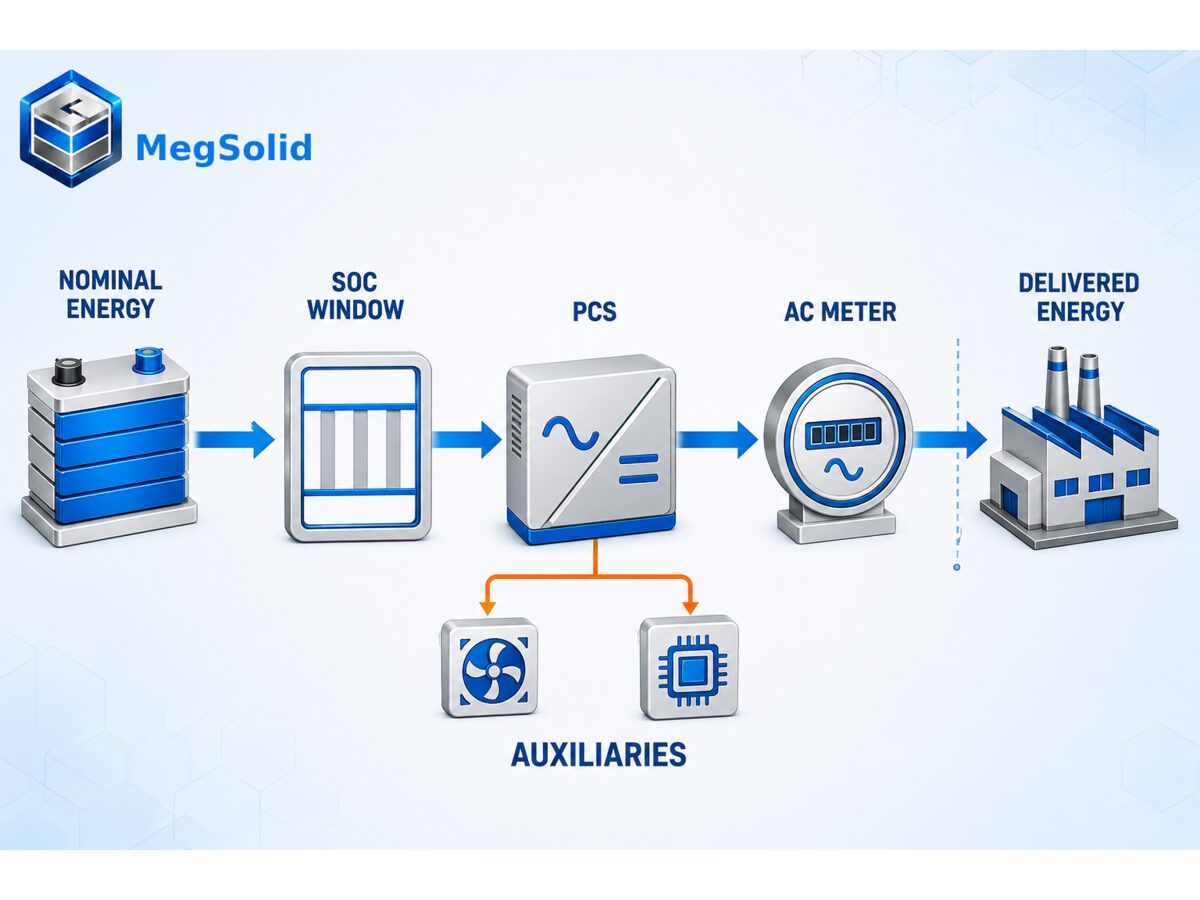
MegSolid ratings illustrate why the distinction matters:
- ESSA0100B-0215: 215.04 kWh nominal energy
- Energon 261: 261.24 kWh nominal energy
Neither rating proves the AC energy available to the LCOS denominator.
Project-specific delivered AC energy should come from the approved electrical boundary. Test SOC, meter placement, test procedure and acceptance criteria remain within the commercial BESS capacity test guide.
LCOS consumes the accepted energy result rather than recreating the test procedure.
With the denominator boundary fixed, annual site demand can then be applied consistently to both proposals.
Use the Same Site Duty, Not Necessarily the Same Annual EFC
Equivalent full cycles are an output of site duty and usable energy, not necessarily a common input for both suppliers.
Suppose the site requires 500 MWh of annual battery discharge:
- Bid A validated usable AC energy: 2.0 MWh
- Bid B validated usable AC energy: 2.5 MWh
The resulting annual utilization becomes:
Bid A annual EFC = 500 MWh ÷ 2.0 MWh = 250 EFC
Bid B annual EFC = 500 MWh ÷ 2.5 MWh = 200 EFC
Both systems are serving the same annual site requirement even though their equivalent full cycles differ.
The correct normalization rule is therefore:
Keep the site dispatch requirement constant and allow each proposal's EFC to follow from its validated usable-energy basis.
C&I operating duty can come from several services:
| Site duty | LCOS operating input |
|---|---|
| Égalisation de la charge | Annual energy required during qualifying peaks |
| TOU shifting | Annual dispatch from tariff windows |
| PV shifting | Usable annual solar surplus |
| Backup + commercial use | Dispatch remaining after reserve |
| Mixed operation | Combined annual discharged energy |
Peak-shaving duty should follow the actual PCC objective described in the battery peak-shaving control guide.
PV headroom should follow the site's strategy in the PV charging priority guide.
Multiple services competing for the same stored energy should follow the approved Logique de priorité du système EMS de BESS.
Power and duration should already be established through the C&I BESS power-to-energy ratio guide. LCOS uses that approved operating requirement instead of reopening the sizing decision.
Once yearly dispatch is known, degradation can be applied to the energy that remains available over time.
Model Degradation Before Calculating Lifetime Delivered Energy
First-year usable energy should not be multiplied by project life and treated as lifetime delivery.
Two systems that appear similar at commissioning can separate materially over 15 or 20 years when their supported degradation profiles differ.
Defensible LCOS modeling calculates:
- 1. delivered AC energy in the first year;
- 2. later-year delivery after degradation;
- 3. energy changes caused by augmentation or replacement;
- 4. the discounted value of future delivered energy.
Common assumptions should remain common:
- site duty;
- environmental basis;
- calculation methodology;
- study period.
Supported product differences should remain visible.
Slower degradation can increase cumulative delivered energy even though both proposals serve the same site requirement. Constant usable energy through the final study year, by contrast, can overstate the denominator and make LCOS appear artificially low.
Degradation also determines when future capacity support may be required.
Include Augmentation Cost When Later-Life Capacity Is Restored
Later-life capacity cannot be restored in the energy forecast without also adding the associated future cost.
Augmentation therefore affects both sides of the LCOS model:
| Augmentation input | LCOS effect |
|---|---|
| Trigger / year | Sets timing of future cost |
| Added capacity | Changes later-life usable energy |
| Installed cost | Adds to lifecycle cost |
| Downtime | May reduce delivered energy |
PNNL's ESGC LCOS methodology separates augmentation from complete storage replacement, which is useful when modeling incremental capacity support rather than assuming an entire storage block is replaced. See the PNNL ESGC LCOS Workbook documentation.
Earlier augmentation can weaken the economic advantage of a cheaper initial bid because future expenditure occurs sooner.
Timing should come from the project degradation model or contractual basis, not from a generic industry year.
Warranty terms then need to support the same operating assumptions that produced the degradation and augmentation forecast.
Check Whether the Warranty Supports Modeled Lifetime Throughput
Financial models can produce artificially attractive LCOS results when lifetime throughput is overstated.
Energy should not remain in the denominator when the contractual operating envelope does not support the modeled dispatch.
Review modeled operation against:
- warranty throughput;
- applicable DoD and SOC limits;
- temperature conditions;
- end-of-life capacity terms;
- relevant dispatch restrictions.
The decision rule is direct:
Modeled lifetime dispatch that exceeds the supported warranty basis should not be used to justify the LCOS denominator.
Detailed interpretation of DoD, EOL and throughput conditions remains in the Guide de garantie C&I BESS.
Warranty information has one specific role here: confirm that the lifetime delivery assumed by the financial model is contractually supportable.
Lifecycle operating expenditure needs the same consistency.
Include O&M and Auxiliary Loads Once
Commissioning does not end project expenditure.
Cooling equipment, pumps, fans, scheduled service, spare parts and mid-life replacement can all change the final cost per delivered kWh.
| Lifecycle item | LCOS treatment |
|---|---|
| Scheduled service | Annual O&M |
| Cooling / auxiliaries | Cost or net-energy treatment |
| Mid-life components | Future lifecycle cost |
| Spare parts | O&M or replacement allowance |
| Service downtime | Reduce delivery when material |
Two accounting rules prevent most errors.
Do not double-count auxiliaries. Net AC delivery may already reflect applicable auxiliary loads, so the same energy loss should not be deducted again.
Do not double-count degradation. Thermal or environmental effects already included in the degradation curve should not be entered again as a separate capacity-loss penalty unless another real cost is also incurred.
Each lifecycle effect should appear once, at the point where it actually changes cost or delivered energy.
Once cost, duty, degradation, augmentation, warranty and O&M are aligned, both bids can finally be placed inside one LCOS model.
Compare Both Bids With One LCOS Model
The example below is illustrative only and does not represent MegSolid product performance or a commercial quotation.
Bid A is normalized as the baseline:
| Lifecycle result | Bid A | Bid B |
|---|---|---|
| Initial cost index | 100 | 108 |
| PV of O&M and service | 18 | 15 |
| PV of augmentation | 14 | 9 |
| Total lifecycle cost | 132 | 132 |
| Lifetime delivered-energy index | 100 | 108 |
Bid A is cheaper at installation.
Future expenditure removes that initial difference, leaving both systems at the same discounted lifecycle-cost index. Bid B then delivers 8% more discounted lifetime energy under the illustrative assumptions.
Bid A LCOS index = 132 ÷ 100 = 1.32
Bid B LCOS index = 132 ÷ 108 ≈ 1.22
Bid B therefore carries the lower LCOS in this example despite the higher initial price.
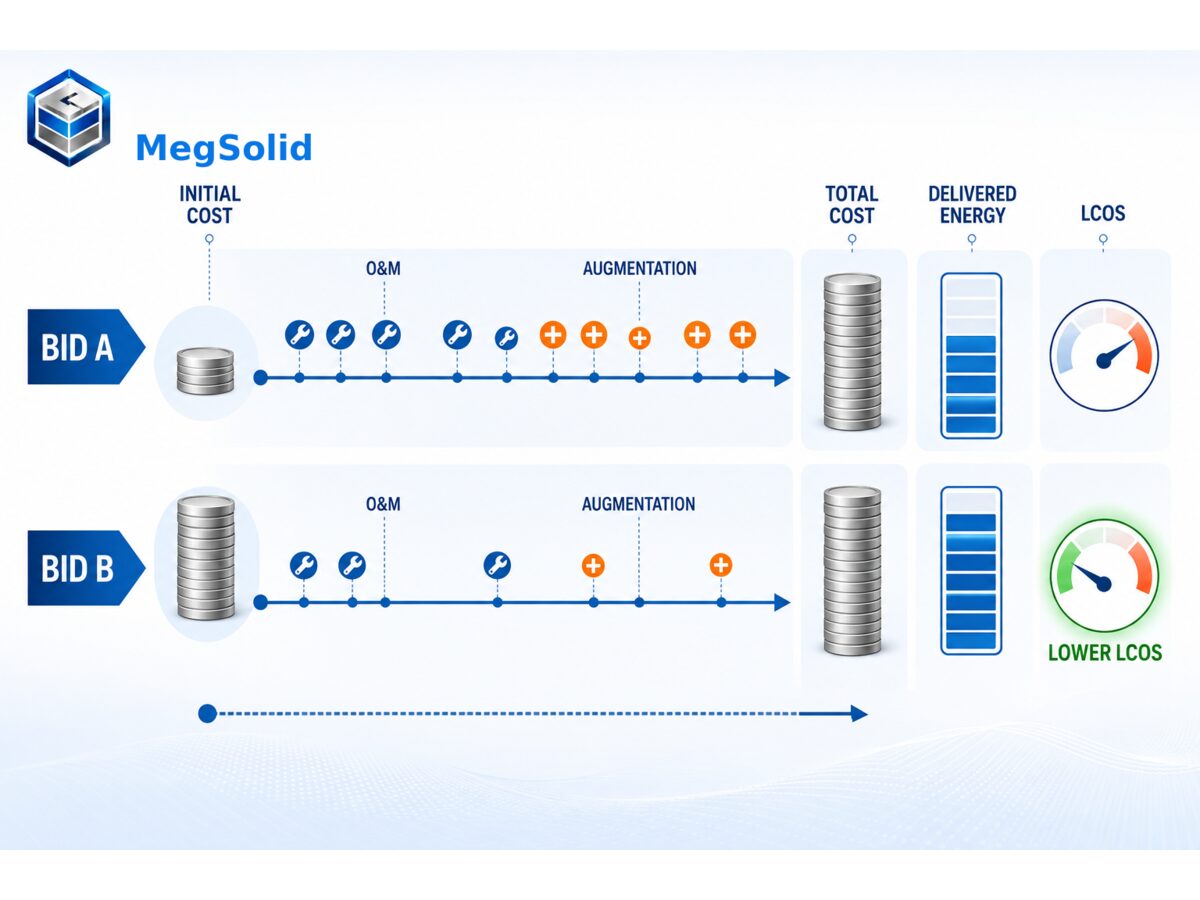
The example does not imply that higher CAPEX should be preferred.
The procurement rule is narrower:
Initial price should decide the purchase only when the complete lifecycle calculation confirms that the same proposal also has the lower cost per delivered unit of energy.
The ranking still needs one final test before it is treated as stable.
Test Whether the LCOS Winner Remains Stable
Base-case LCOS alone is not sufficient when realistic changes in assumptions can reverse the ranking.
Sensitivity analysis should focus on the inputs capable of moving the decision:
- annual discharged energy;
- degradation;
- augmentation timing;
- charging electricity price;
- O&M;
- discount rate.
Results can be interpreted directly:
| Sensitivity result | Signification du terme « approvisionnement » |
|---|---|
| Same bid wins across credible cases | Ranking is robust |
| Realistic assumptions change the winner | Resolve the uncertain input first |
| Only extreme cases change the winner | Ranking is reasonably stable |
The break-even point often matters more than the base-case number.
Ranking that changes under a realistic dispatch or augmentation scenario should not be released as a firm procurement conclusion until the uncertain input has stronger evidence.
Once the storage proposals have been ranked, LCOS still does not answer whether the project itself creates enough value.
LCOS and ROI Answer Different Questions
LCOS evaluates the cost of storage delivery. ROI evaluates the economic benefit created by the storage project.
| Metric | Decision |
|---|---|
| LCOS | Which BESS proposal costs less per delivered unit of energy? |
| ROI | Does installing the BESS create sufficient economic value? |
Peak-shaving savings, tariff arbitrage revenue and avoided production losses belong in the project-value model, not in LCOS merely to make the storage cost look lower.
Low LCOS can still produce weak ROI when the site has limited value available to capture. Higher LCOS can still support attractive returns when demand charges, tariff spreads or operational losses are substantial.
The value side remains in the C&I peak-shaving ROI guide.
The decision sequence therefore stays clear:
LCOS selects between technically suitable storage proposals; ROI determines whether the selected storage project is economically worth installing.
Which MegSolid Data Belong in the LCOS Model?
Product datasheets provide equipment facts, but those facts should only be used for the quantities they actually describe.
| Published field | Correct LCOS use |
|---|---|
| ESSA 215.04 kWh | Nominal energy reference |
| ESSA 100 kW | Rated AC power input where relevant |
| ESSA intelligent air cooling | Thermal architecture, not an O&M cost |
| Energon 261.24 kWh | Nominal energy reference |
| Energon 125 kVA | Apparent-power rating, not 125 kW |
| Energon maximum system efficiency 90% | Not round-trip efficiency |
Energon 261 uses liquid cooling, but cooling architecture alone does not determine lifecycle O&M or auxiliary consumption. Project conditions and actual operating duty still control those assumptions.
Complete LCOS modeling therefore needs additional project-specific inputs:
- validated delivered AC energy;
- site dispatch requirement;
- project RTE or approved net-energy basis;
- degradation;
- warranty-supported throughput;
- O&M;
- augmentation;
- charging-cost treatment;
- discount rate.
Datasheet values define the equipment. Project evidence defines how that equipment enters the lifecycle model.
Final C&I BESS LCOS Release Check
Headline $ / kWh or supplier-reported LCOS should no longer control the decision at this stage.
| Check | Condition de libération |
|---|---|
| Champ d'application | Same study period and project boundary |
| Énergie | Same AC delivery definition |
| Duty | Same site dispatch requirement |
| Lifecycle | Degradation, O&M and augmentation included |
| Contract | Warranty supports modeled operation |
| Finance | Common cost and discount methodology |
| Sensitivity | Lower-LCOS ranking remains credible |
Missing any core condition means the two results are not yet ready for procurement comparison.
The release sequence is:
Normalize project scope → define AC delivered energy → apply the same site duty → model degradation → include augmentation and O&M → verify warranty support → discount cost and energy → compare LCOS → test sensitivity
The winning proposal is not automatically the one with the smallest quoted $ / kWh.
The technically acceptable system that retains the lower levelized cost of energy storage after common project assumptions and genuine product differences have been accounted for has the stronger lifecycle-cost case.
Model assumptions should remain attached to the final LCOS result when engineering hands the comparison to procurement or finance. Separating the number from its duty, measurement boundary or augmentation basis can make a previously valid comparison misleading.
Teams ready to move from analysis into supplier selection can use a structured LCOS comparison sheet to keep cost scope, delivered-energy boundary, site duty, degradation, augmentation, warranty and financial assumptions in one review record instead of comparing isolated supplier numbers.
FAQ
What is BESS LCOS?
BESS LCOS, or levelized cost of storage, compares lifecycle storage cost with lifetime delivered energy. Competing systems should use the same project, energy and financial boundaries before their LCOS values are ranked.
What is a good LCOS for battery storage?
No universal LCOS value defines a good battery project. Duration, geography, charging price, utilization, financing, degradation and calculation methodology can materially change the result.
Is battery storage cost per kWh the same as LCOS?
No. Installed cost per kWh measures initial capital cost against an installed-energy basis, while LCOS includes lifecycle cost and lifetime delivered energy.
Should charging electricity be included in BESS LCOS?
Charging electricity may be included or excluded depending on the declared methodology. Competing LCOS values should only be ranked when both models treat charging energy consistently.
Should nominal battery capacity be used as the LCOS denominator?
Not automatically. C&I LCOS should use project-specific delivered AC energy at the defined measurement boundary rather than assuming nameplate kWh equals site-delivered kWh.
How does degradation affect BESS LCOS?
Degradation reduces later-life delivered energy. Year-by-year energy modeling therefore provides a more defensible denominator than assuming first-year usable energy remains constant.
How is augmentation included in LCOS?
Augmentation adds future lifecycle cost and changes later-life usable energy. Timing, added capacity and installed cost should all be reflected in the same model.
Should two BESS bids use the same annual EFC?
Not necessarily. Both bids should use the same site dispatch requirement. Different validated usable-energy values can produce different annual equivalent full cycles.
Does higher efficiency always mean lower LCOS?
No. Net delivered energy matters, but CAPEX, degradation, O&M, augmentation, utilization and financing also influence LCOS.
Is lower LCOS the same as higher ROI?
No. LCOS compares storage cost per delivered unit of energy, while ROI evaluates whether the project creates sufficient economic value.
Why can Lazard and Ember report very different battery LCOS values?
Different charging-energy treatment, geography, financing, utilization and modeling assumptions can produce materially different LCOS results.
Can utility-scale LCOS benchmarks be used directly for a factory BESS?
Utility-scale benchmarks can provide market context, but factory duty, delivered energy, O&M, augmentation and financing may differ substantially from benchmark assumptions.
What must match before two C&I BESS LCOS values are compared?
Study period, cost boundary, AC energy definition, site dispatch requirement, charging-cost treatment and financial methodology should be aligned first. Genuine product differences should remain in the model.